
This week, we begun image classification for practical 5 and 6. Over the past few weeks, I have come to familiarise myself with the initially daunting ENVI programme and I feel I am slowly becoming more adaptable and independent in my use. Image classification is essentially when the user or computer assigns a pixel with a unique spectral profile, as covered previously, to a given name, in this case land cover (Lillesand and Keifer, 1994).
Supervised classification
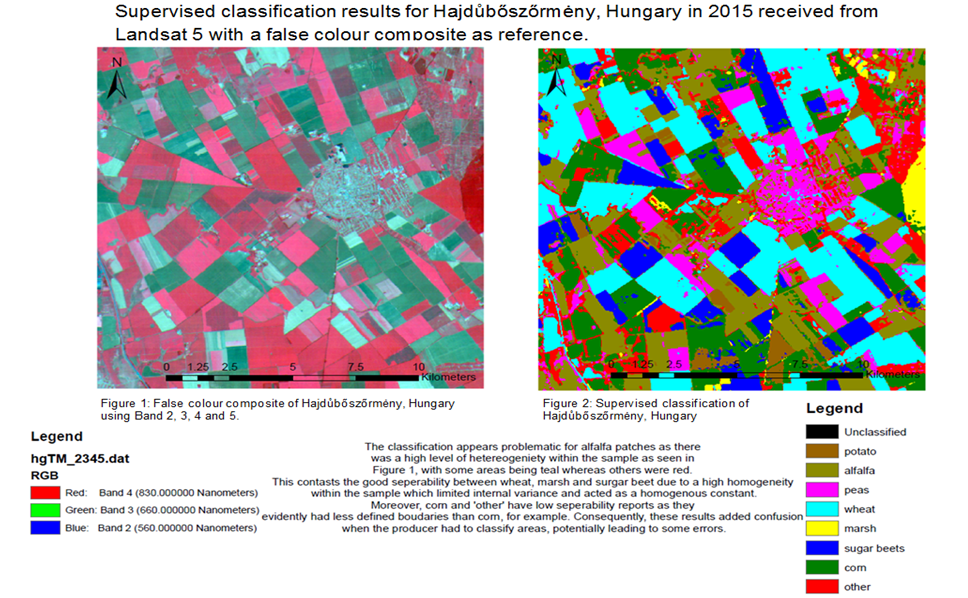
Out of supervised and unsupervised, I preferred supervised classification. Supervised classification, as defined by Al-doski et al. (2013), is where the user identifies the training site to classify the pixel through its spectral signature. I found it rewarding and enjoyable to create different training sets and to see the map outcome. It enlightened me to the internal variability of different vegetation, such as my alfalfa data and the necessary steps to remedy this including combining classes.
Unsupervised classification
Unsupervised classification is useful where ground truth is not known, meaning the computer groups land-cover types based on the spectral criteria (Al-doski et al., 2013). We used the k-means algorithm to classify the image, yet I was curious as to the IsoData algorithm and its uses within unsupervised classification. I found that IsoData was a modification of the k-means algorithm, designed as an alternative algorithm addressing some of the issues with k-means. IsoData automatically merges clusters with similar spectral signatures and equally removes potential clusters that are low in population.
Accuracy assessment
We produced confusion matrices for our two classifications. Initially I understood the ‘confusion’ aspect! However, after taking some time to research, the copious amount of numbers could be simplified and the key messages inferred. Once understood, I found the kappa coefficient a useful tool for assessing the accuracy of both my maps produced and as a visual learner, it took an overwhelming amount of numbers into a more tangible outcome by seeing how well our maps agreed with the group truth and if the analysis was performed by chance alone. I was pleased to see my supervised classification has a kappa coefficient of 80%!
